< Academy
AutoSchemaKG: Letting a Knowledge Graph Design Itself
Research

Tamim Hussein
ML Engineer
Building a knowledge graph usually starts with a whiteboard. An expert sits down and decides, in advance, what kinds of entities and relationships the graph will hold. In a recent Passion Academy session, Tamim Hussein looked at AutoSchemaKG, a framework that skips that step, and used alopecia areata (AA) research as a case study to show what that actually looks like in practice.
Picture Sara, a biomedical researcher, trying to turn a pile of AA papers into a structured graph. The traditional way is to design the schema first, deciding that:
Only then does she start reading papers and fitting each finding into those predefined boxes.
The problem is that research moves faster than any fixed schema can. A paper comes along describing a new immune-cell subtype, or a treatment event, or a causal mechanism that doesn’t cleanly fit any existing category. Now Sara has to stop and revise the schema itself before she can carry on. In a fast-moving field, the schema stops being a helpful structure and starts being the thing slowing everything down.
AutoSchemaKG isn’t one model, it’s a framework that coordinates several pieces working together. At the top sits the method itself, which handles extraction, concept-building and graph construction.
Underneath that is atlas-rag, the actual Python package that runs the pipeline. That package calls on an LLM, such as Llama or Qwen, to do the reading and reasoning. The final output is a knowledge graph, exported as CSV or GraphML files, ready to load somewhere else.
The paper behind it (Bai et al., ACL 2026) reports some genuinely large numbers from their own experiments: over 50 million documents processed, more than 900 million nodes, 5.9 billion edges, over 95% extraction precision,and measurable gains in both multi-hop question answering and factual accuracy.
Note: These are the authors’ own benchmarks, not an independent test against a tool like Neo4j.
The pipeline can be broken down into six stages, moving from raw papers to a finished graph.
Put together, the finished graph connects the specific facts (gene → cytokine → pathway → disease mechanism → disease) to this general concept layer. This is what lets you ask a question like “what drug interrupts the pathway that leads to this disease?” and have the graph actually trace a path to the answer.
“Dynamic” here means the labels and categories come from whatever is in the corpus you feed it, so a different set of papers produces a different set of concepts. It does not mean the graph is constantly rewriting itself in real time as new information arrives.
Feeding in a new paper still means running it through the same extraction and labelling steps, matching it against existing entities where possible and merging the result into the graph. This is a process that needs something external to trigger it. New facts and labels get added but the existing structure doesn’t get reorganised from scratch every time. In practice, this is closer to a scheduled batch job than a live, self-updating system.
The paper is upfront about some of its own limits. The model’s biases and blind spots carry straight through into the graph, since extraction is only as good as the LLM doing it. Highly specialised, technical fields are genuinely hard to organise well. And in places where the source material is sparse, the resulting graph can end up with gaps or inconsistencies.
A few more practical gaps are worth naming:
This is a research pipeline, not production infrastructure. Automating the construction of a graph doesn’t remove the need for someone to govern it.
A natural question is whether this replaces a graph database like Neo4j. It doesn’t, because the two are solving different problems.
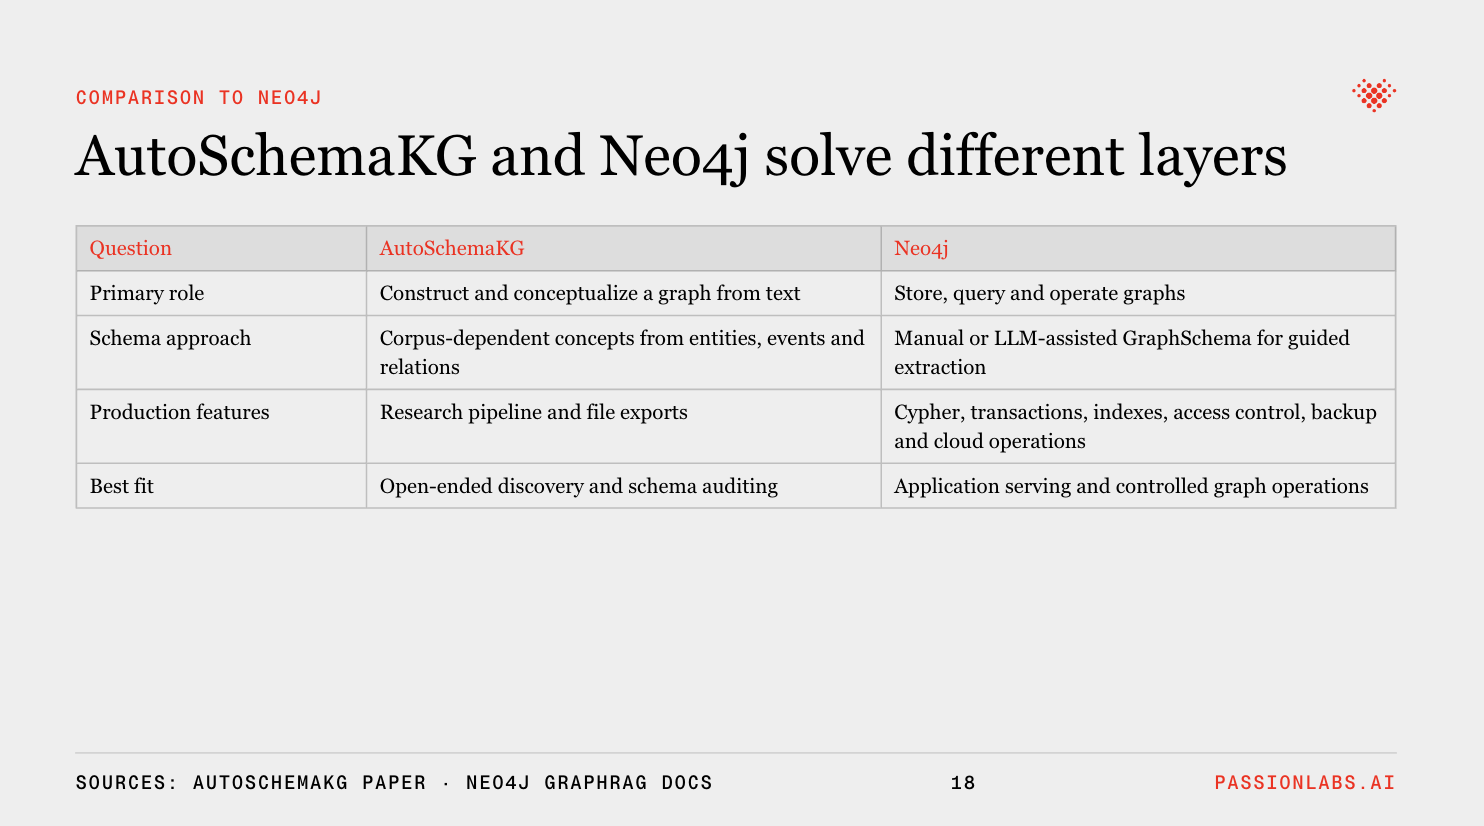
Put together, a realistic setup looks like a short pipeline
Each part does the piece it’s actually good at. AutoSchemaKG does the heavy lifting of reading and structuring raw text. A human reviewer brings judgment the system doesn’t have. Neo4j brings the reliability and query performance you need once the graph is actually being used for something.
AutoSchemaKG solves a real and specific problem: in a field that moves quickly, designing a schema by hand becomes the bottleneck on getting new findings into a usable graph. Letting the structure emerge from the literature itself removes that bottleneck.
What it doesn’t do is replace judgment. It will still mix up synonyms, leave contradictions unresolved and need a human to decide what actually matters (especially in a field like medicine where getting it wrong has real consequences). Used as a fast way to get a first draft of a graph off the ground, rather than a finished, production-ready system, it’s a genuinely useful tool.